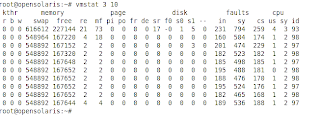
vmstat provides you a one line overall system behavior. I suggest starting out with vmstat tool to understand system behavior before using more detailed tools such as DTRACE.
vmstat provides you a detail on runnable threads, memory, disk, faults, cpu utilization as shown below.

Following definitions have been taken from "Solaris Performance and Tools" book by Richard McDougall.
Counters
kthr:r -> Total number of runnable threads on the dispatcher queue. It provides information on CPU saturation.
faults:in -> number of interrupts per second
faults:sy -> number of system calls per second
faults:cs -> number of context switches per second, both voluntary and involuntary
cpu:us ->percent user time
cpu:sy -> percent system time
cpu:id ->percent idle time
Description
vmstat 3 10 -> means display vmstat information 10 time with a 3 second interval.
For me the most important counters are kthr:r, kthr:b and CPU id.
Bit of explanation on the vmstat picture.
1: First line is a summary since boot.
1: There are no threads waiting in the queue to get CPU time slice. kthr:r = 0. If this value is more than 2 and sustained on a single CPU server then it indicates that CPU saturation.
2: There are no threads waiting on a resource. kthr:b = 0. If this value is more than 0, it might suggest that we may have a bottleneck somewhere. You need to look at these counter over a long duration before making any conclusion.
3: On average, CPU is spending 1% of its time servicing user-mode threads, 2% servicing kernel threads and 97% ideal.
You can save vmstat to a text file from command line for further analysis as follows. To make my log file unique I normally use datetime and pid values:
vmstat [interval] [total count] >>~/[location where to save]/vmstat_`date +%y%m%d_%H%M%S`_$$.txt
i.e.
vmstat 5 5 >>~/Desktop/PerfTools/vmstat/vmstat_`date +%y%m%d_%H%M%S`_$$.txt
This will save a file as vmstat_101111_135557_824.txt in location /Desktop/PerfTools/vmstat/.
This file will consist of 5 vmstat records with 5 second interval between each record.
vmstat 5 >>~/Desktop/PerfTools/vmstat/vmstat_`date +%y%m%d_%H%M%S`.txt
This file will continue saving the data indefinitely with 5 second interval.
1 comment:
Thanks much for posting this.
Post a Comment